Optical properties and collective excitations of plasmons in semiconductor superlattices in magnetic fields
Magnetic field dependence of the energy of negatively charged excitons in semiconductor quantum wells

|
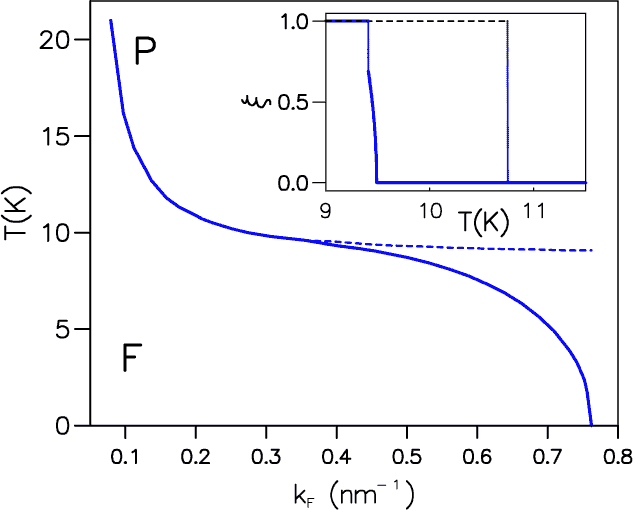
Phase diagram of a DMS quantum well, using the parameters described in the text. Full and broken lines represent
first- and second-order phase transitions, respectively, between ferromagnetic (F) and paramagnetic (P) phases. In the inset we
show the carrier spin polarization for two different densities. The broken line corresponds to kF = 0.2 nm-1, in this case there is
a first-order transition between the x = 1 ferromagnetic phase and the paramagnetic phase. The continuous line corresponds to
kF = 0.39 nm-1. Upon lowering the temperature we obtain a continuous transition between the P and the F phases followed by
an abrupt transition between two F phases with different values of x . As commented in the text, this last
transition is probably spurious.
(Brey and Guinea [2000]) |
|
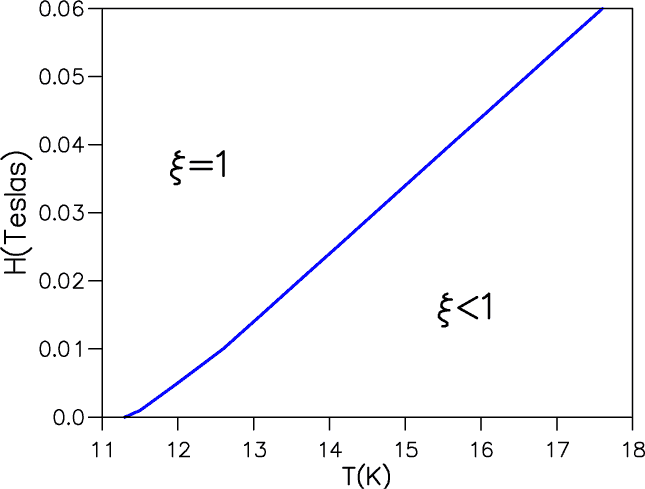
Phase diagram of a DMS quantum well as a function of T and magnetic field for a hole density such that
kF = 0.2 nm-1.
The line separating the fully polarized from the partially polarized system represents a first-order transition.
(Brey and Guinea [2000]) |
|
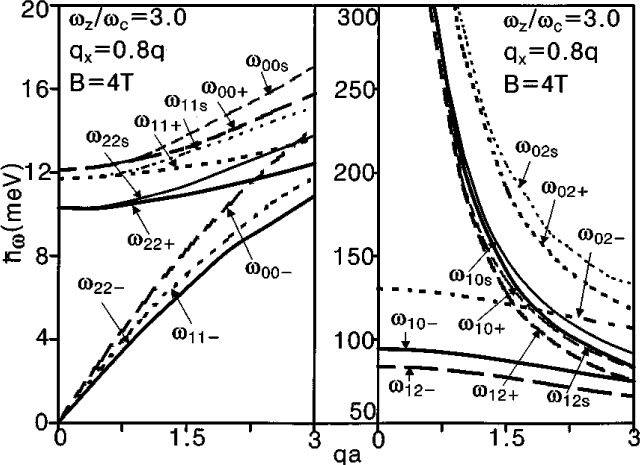
Dispersion relation \
w versus q a for surface and bulk
magnetoplasmons due to the intra- and inter-Landau levels (left-hand side and right-hand side),
where the wij+ and
wij- are maximum and minimum dispersion energy of the bulk magnetoplasmon
modes, respectively, and the wijS
is the dispersion energy of the surface magnetoplasmon modes. Here i and j represent the Landau
level index, respectively.
The values of the parameters are as follows:
n = 7.7x1011 cm-2, a = 82.7 nm,
L = 30 nm, m= 0.0665 m0 ,
e = 13.1,
e0 = 1.0, and
Eij = (i-j)hw
(Haeng Lee et al. [2001]) |
|
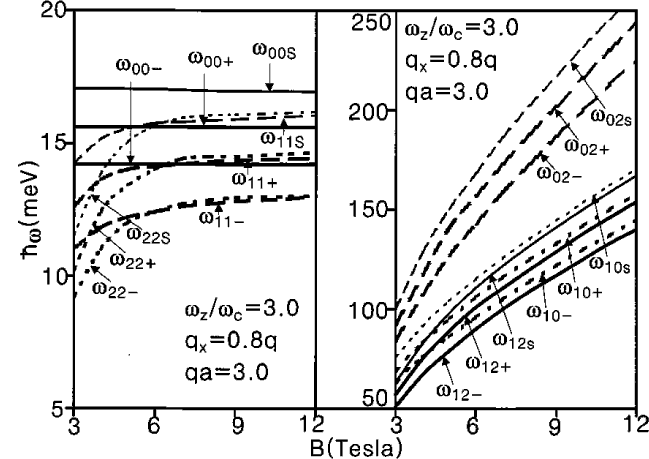
Dispersion relation hw
versus the strength of magnetic field B for surface and bulk magnetoplasmons due to the intra- and inter-Landau levels (left-hand side and right-hand side).
The values of the parameters are as follows:
n = 7.7x1011 cm-2, a = 82.7 nm,
L = 30 nm, m= 0.0665 m0 ,
e = 13.1,
e0 = 1.0, and
Eij = (i-j)hw
(Haeng Lee et al. [2001]) |

|
Dispersion relation hw
versus the ratio of the confining
potential parameter to cyclotron resonance frequency wz/wc
for surface and bulk magnetoplasmons due to the intra- and inter-Landau
levels (left-hand side and right-hand side).
The values of the parameters are as follows:
n = 7.7x1011 cm-2, a = 82.7 nm,
L = 30 nm, m= 0.0665 m0 ,
e = 13.1,
e0 = 1.0, and
Eij = (i-j)hw
(Haeng Lee et al. [2001]) |
|
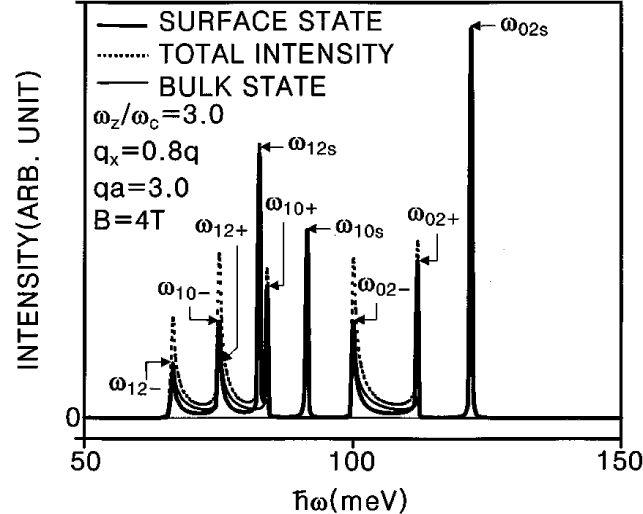
Raman intensities for surface and bulk magnetoplasmons
due to the inter-Landau levels at a specific value of qa = 3.0 and
kz = 2pa/5.
The values of the parameters are as follows:
l = a2d = L, N = 40
and g = 0.02 meV.
(Haeng Lee et al. [2001]) |
|
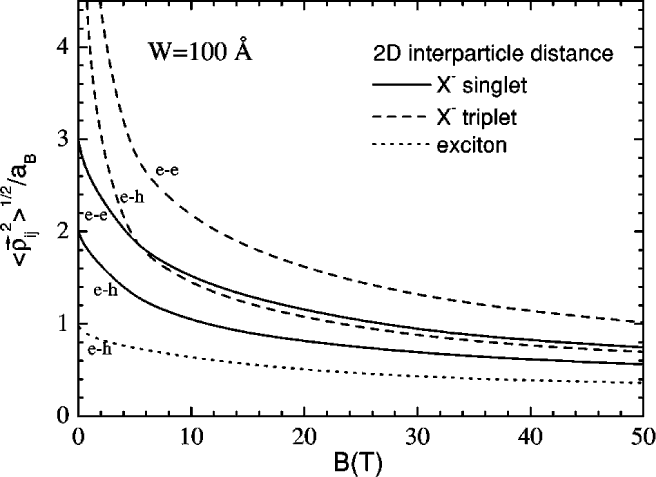
The 2D average interparticle distance versus the magnetic
field for the exciton, and the singlet and triplet states of the
charged exciton in a quantum well of width 100 Å.
(Riva et al. [2001]) |
|
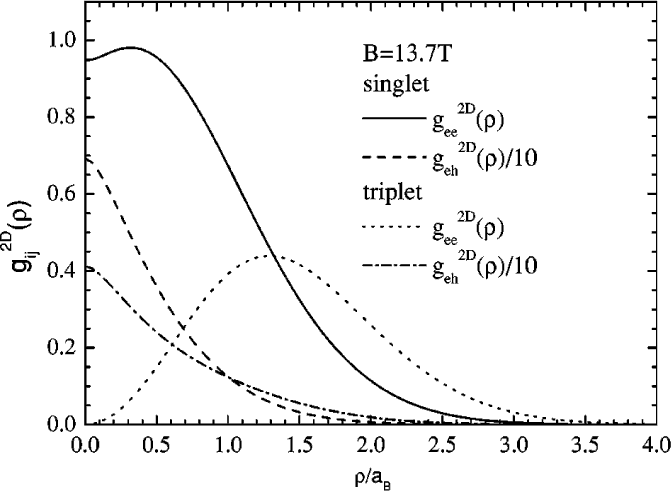
The 2D pair correlation function versus the magnetic field for the exciton and the spin-singlet and spin-triplet states of a
charged exciton in a 100 Å wide quantum well.
(Riva et al. [2001]) |
|
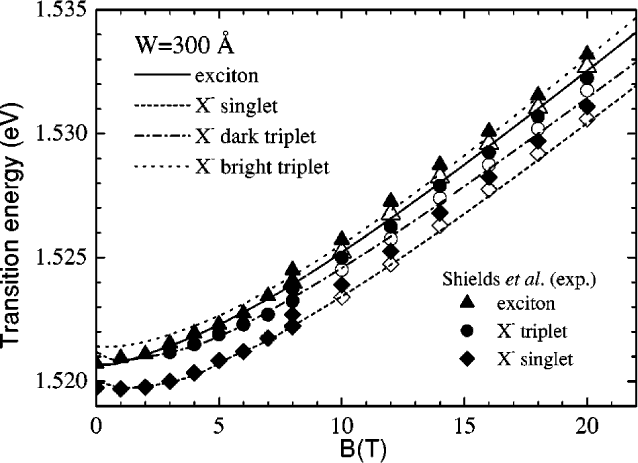
Comparison between the experimental and theoretical transition energies for charged excitons and excitons in a 300 Å
wide quantum well. The open symbols are the experimental results for B > 8 T shifted by 0.5 meV.
(Riva et al. [2001]) |
|
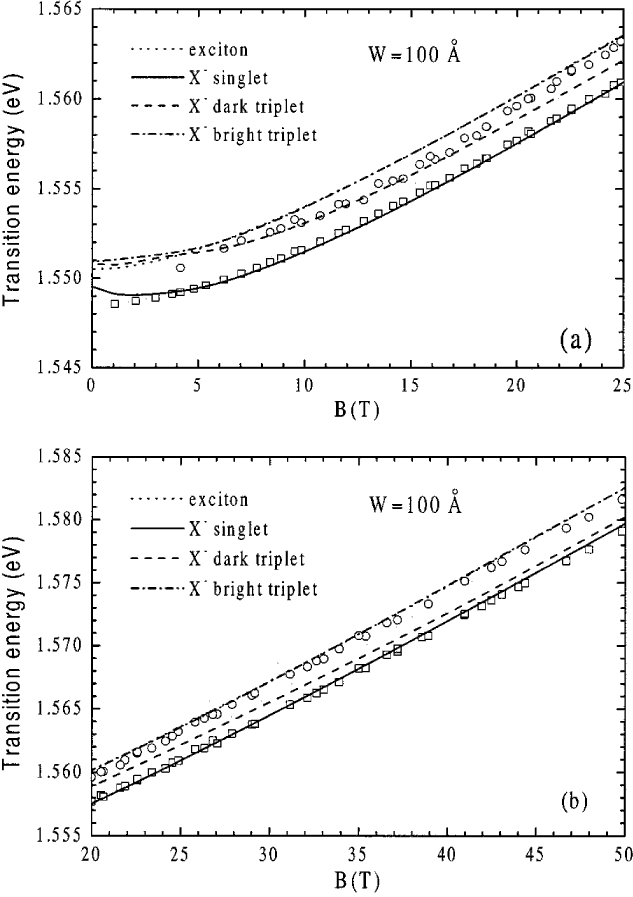
Comparison between the experimental and the theoretical transition energies for charged excitons and excitons in a 100 Å
wide quantum well. For clarity, the low magnetic field region are shown.
The symbols are the experimental results.
(Riva et al. [2001]) |

|
Comparison between the experimental and the theoretical transition energies for charged excitons and excitons in a 100 Å
wide quantum well. For clarity, the high magnetic field region are shown.
The symbols are the experimental results.
(Riva et al. [2001]) |
|
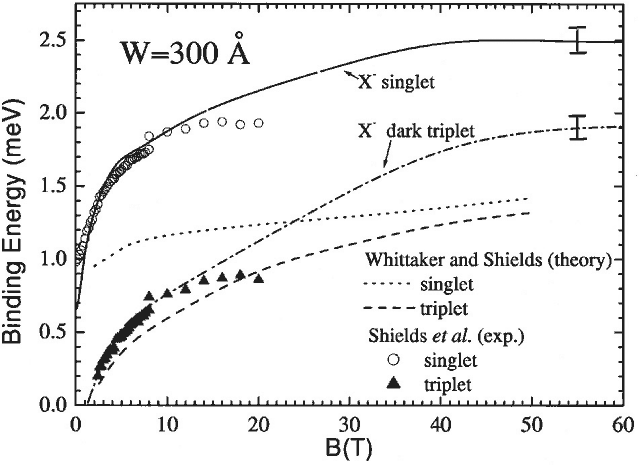
The binding energy of a charged exciton in a 300 Å.
(Riva et al. [2001]) |
|
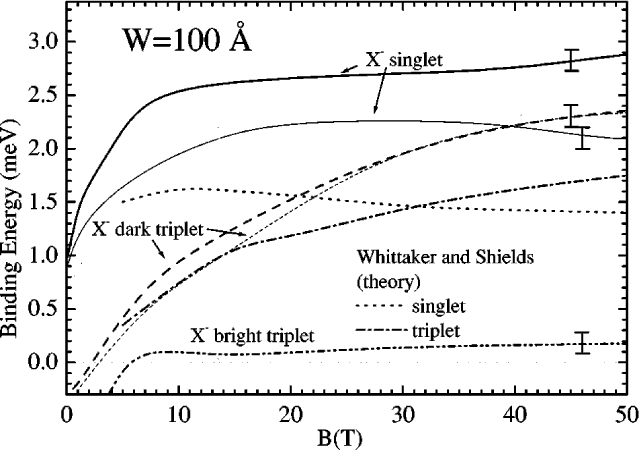
The binding energy of a charged exciton in a 100 Å wide quantum well calculated using the symmetric hole mass approximation
(thick curves) and the asymmetric hole mass approximation (thin curves).
(Riva et al. [2001]) |
|
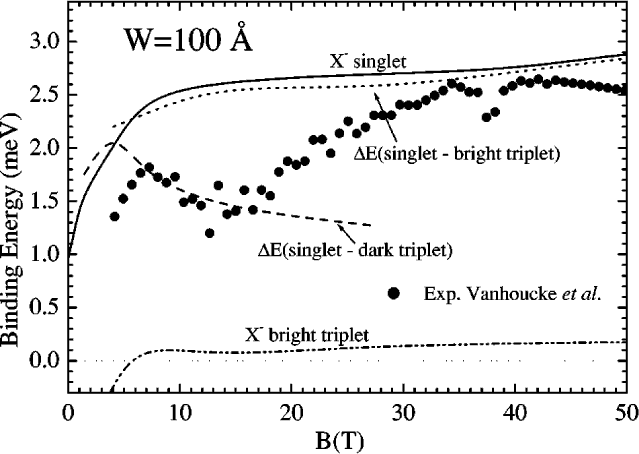
Comparison of the difference in energy between the
upper and lower s - transition lines (symbols) with our
theoretical binding energy for the negative trion singlet state (solid curve), the energy difference between our theoretical dark triplet
and singlet states (dashed curve), and the energy difference between our bright triplet and singlet states (dotted curve).
(Riva et al. [2001]) |