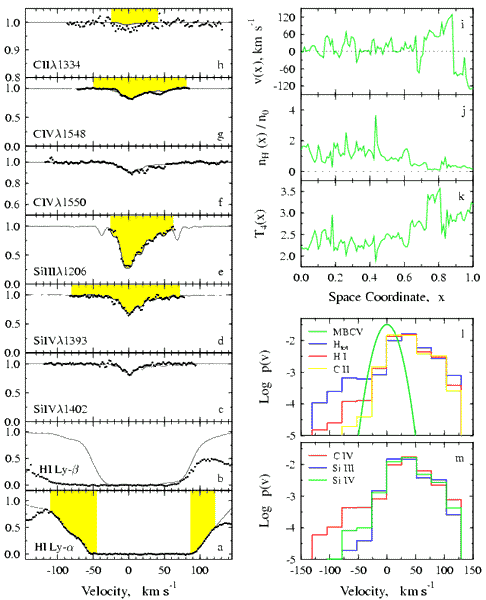

(a-h). Observed normalized intensities (dots) and theoretical (solid curves) profiles of the absorption lines from the z_a = 3.514 system (note different scales in panels h and f). Yellow areas mark pixels which are critical to the MCI fit.
(i-k). The corresponding MCI reconstraction of the radial velocity, density, and kinetic temperature T_4 which is given in units of 10^4 K.
(l, m). The corresponding density-weighted radial velocity distribution functions, p(v), for the total H_tot and neutral HI hydrogen, CII, CIV, SiIII, and SiIV as restored by the MCI. For comparison, in panel l the green curve shows p(v) adopted by Molaro et al. in the VPF analysis.