Space-time distribution of matter in the Universe
 Peculiarities of the space-time distribution
of absorption-line systems observed in QSO spectra
within a cosmological redshift
interval z=0.2-3.2 were analysed by
Ryabinkov et al. (1998, 1999)
and Kaminker et al. (2000).
The authors used the absorption lines
of the resonance doublets C IV and Mg II
as indicators of absorbing material existing at the
redshifts under study.
These spectral lines are usually observed in
QSO spectra with high emission-line redshift ze.
Results of the statistical analysis
indicate that
the overall
z-distribution of absorbing matter is non-uniform:
it has statistically significant maxima (peaks) and
minima (depressions), and
positions of peaks and depressions
of the z-distribution turn out to be the same
(within the statistical uncertainty) for different
celestial hemispheres independently of their orientation.
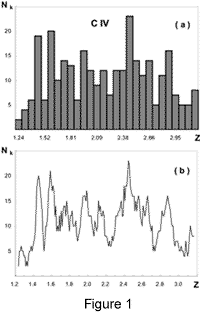
Figs. 1a and 1b
show the z-distribution of the 299 C IV absorption systems.
Fig. 1a is a histogram obtained for independent
bins Dz=0.071.
Fig. 1b presents the
distribution obtained in so-called
sliding-average approach, in which
a set of consecutive shifts is performed
of an averaging bin Dz = 0.071
along the z-axis with a step 0.01.
 Positions
of the maxima (peaks) zm
were determined as weighted
mean values (centers of gravity)
of the points forming a peak
relative to the trend of the distribution
obtained in the sliding-average approach.
The corresponding values of zm are
1.46, 1.60, 1.78,
1.98, 2.14, 2.45, 2.64, and 2.86, with accuracy ±0.04
(half of the bin width).
The significance levels of the peaks
are estimated as 3s, 3s, s, 2s, s, 3s, 2s, 2s,
respectively.
The results for Mg II absorption-line systems
are quite consistent with the results discussed above.
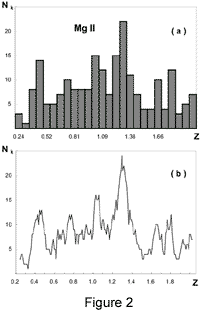
Figs. 2a and 2b
show the z distribution
of 216 Mg II absorption systems.
The values of the centers of gravity of the peaks
are equal
zm= 0.44, 0.77, 1.04, 1.30, 1.66, and 1.78 (±0.04).
The significance values of the peaks are 2s, s ,3s, 4s, s, s,
respectively.
One can see, that the last two peaks
of Mg II systems are in a good agreement
with the second and third peaks in the
distribution of C IV systems.
 Isotropy (or anisotropy)
of distributions was tested
by comparison of
the z-distributions
in opposite independent hemispheres.
For this purpose the celestial sphere was divided
(Equatorial coordinates) into
two hemispheres separated by the plane passing through the
world axis (d=±90°,
d is a declination).
This plane was rotated about the world axis
by steps Da=15° (1h),
where a is a right ascension.
For each hemisphere, it was produced the z-distribution
of the absorption systems.
A correlation coefficient r was calculated
for each pair of independent hemispheres
and comparison of values r
was performed with tabulated values
rb of the sample correlation coefficient
for a given confidence level b.
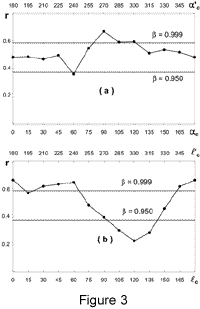
Fig. 3a
represents the correlation coefficients for the
z-distributions in pairs of opposite hemispheres
as a function of the right ascensions of the centers
of the hemispheres.
It is clear that
the correlation of the z-distributions
is significant, as a rule, at the
2s level (b³0.95).
To verify that the positions of the distribution maxima
do not depend on an orientation
of the rotation axis
it was performed
the procedure described above but with another
rotation axis.
The Galactic coordinates
(l, b) (l and b are the Galactic longitude
and latitude)
were used
instead of the Equatorial ones.
Fig. 3b represents
the correlation coefficients
for the z-distributions
as a function of the Galactic longitudes
of the centers of the hemispheres.
In addition,
possible regularity (periodicity)
of the z-distribution
obtained was tested
within the total interval
0.2£z£3.2,
exploring two independent methods:
regression analysis of the peak values zm, and
power spectrum analysis of the available sample of redshifts.
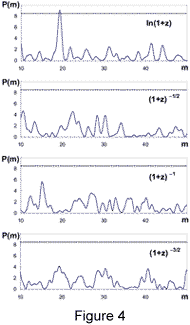
 In particular, the results of the power spectrum analysis
for four trial functions
are represented in Fig. 4.
One can see that
in the interval of m considered
the only significant peak of P(m) appears
for the function
f(z)=ln(1+z) at m=19 on the confidence level
b=0.99989 . This peak corresponds to
a periodicity of the distribution
in respect to this function with a period
D=F/m=0.066 ±0.003.
This is quite consistent with the results of the
regression analysis mentioned above.
Let us note that the power spectrum analysis
does not depend on the choice of redshift bin
and may be treated as additional evidence
for the existence of the peak-depression
structure discussed above on the significance level
(~4s).
The distribution obtained can be imagined
as a series of embedded
spheres of absorbing material (onion-like structure)
corresponding to the peaks
at zm indicated above.
Such structure may be considered
as a Global Large-Scale Structure (GLSS)
of the space-time distribution,
and most likely is
associated with an appearance of
pronounced and depressed
epochs in the course of cosmological evolution.
The characteristic time T between the maxima
of pronounced epochs strongly depends on the cosmological
model and/or on a trial function explored.
For instance, one can estimate that
T=D/H0=(650±30)h-1
Myr for the trial function ln(1+z) and
T=2D/H0=(400±60)h-1
Myr for the trial function (1+z)-1/2.
Let us stress that there is no contradiction
between the GLSS considered and the statement
that all points of space are equivalent
(the cosmological principle).
The GLSS does not correspond to a fixed cosmic
time, but displays the time evolution.
As an example of the pronounced epochs
appearing as isotropic elements of the GLSS
one may considered the epoch of the hydrogen recombination
associated with formation of the
Cosmic Microwave Background.
Most probable that GLSS should appear in
statistics of other independent indicators
of matter, e.g., in statistics of quasars,
high-redshifted galaxies, AGNs, and so on.
Comprehensive statistical analysis
of QSOs and related objects is carried out
just now in our Department. A plenty of preliminary
distributions have been calculated for this aim
as a basis for following more eloborated calculations.
A few illustrations of such distributions are
presented in the Notebook
"Quasars and Active Galactic Nuclei".
We hope that the illustrations will be filled up
and improved with time.
References
Ryabinkov A.I., Varshalovich D.A., Kaminker A.D., 1998,
Astron. Lett. 24, 418
Ryabinkov A.I., Varshalovich D.A., Kaminker A.D., 1999,
Gravitation & Cosmology Suppl., Proceedings of "Cosmion-96"
and "Cosmion-97", Part II, p. 72.
Kaminker A.D., Ryabinkov A.I., Varshalovich D.A., 2000,
Astron. Astrophys. 358, 1.
 Peculiarities of the space-time distribution
of absorption-line systems observed in QSO spectra
within a cosmological redshift
interval z=0.2-3.2 were analysed by
Ryabinkov et al. (1998, 1999)
and Kaminker et al. (2000).
The authors used the absorption lines
of the resonance doublets C IV and Mg II
as indicators of absorbing material existing at the
redshifts under study.
These spectral lines are usually observed in
QSO spectra with high emission-line redshift ze.

