

Konus-WIND Solar Flares
This page contains information about solar flares detected by Konus-WIND [1] in the trigger ("Burst") mode.
The pages for individual years contain the tables with the following data:
- #: the sequence number of a flare(from the beginning of the mission).
- Trigger Date: the UTC Konus-WIND trigger date YYYY-MM-DD.
- Trigger Time (T0): the UTC Konus-WIND trigger time HH:MM:SS.SSS (sssss.sss).
- Class: the flare class assigned by GOES.
- GOES Tbegin: the UTC time of the beginnig of the flare as reported by GOES.
- GOES Tmax: the UTC time of the maximum of the flare as reported by GOES.
- GOES Tend: the UTC time of the end of the flare as reported by GOES.
- Light Curve: the link to the pdf figure of the Konus-WIND light curve of the flare. Each figure has two panels: the left panel shows the time profile of the flare in three energy channels (and their sum) with a resolution of 1.024 s obtained from the "Burst" mode data (from T0-0.512 s to T0+230 s), and the right panel shows the profile with a resolution of 2.944 s obtained from the "Background" mode data (from T0-250 s to T0+250 s; scaled to 1.204 s for ease of comparison). The vertical dashed lines denote the time intervals over which multichannel energy spectra were accumulated. The horizontal red dashed lines denote the background levels. The nominal energy ranges of the three channels G1, G2, G3 are 10–50 keV, 50–200 keV, and 200–750 keV. Due to degradation of the photomultiplier tubes, the energy ranges G1, G2 and G3 have shifted to ~20–77 keV, 77–310 keV and 310–1180 keV by 2013.
A tab-delimited txt-table with Konus-WIND flares for all the years of operating (automatically updated): KonusWIND_SolarFlares.txt
A zip-archive with all pdf light curve figures: KonusWIND_SolarFlares_lc_fig.zip
A brief overview of the solar flare observations with Konus-WIND is given in [2].
Note: Only flares listed in the GOES archive [3] and satisfying the condition: Tbegin(GOES) ≤ T0 ≤ Tmax(GOES) are given in the tables.
Notes about lc:
- Since the light curve figures are produced automatically from raw data, they may contain gaps, glitches, and overflows; the background levels can be incorrect.
- Periodic structure seen in the light curves recorded by the S1 detector are due to periodic occultations of Konus-WIND by other instrument on the spinning s/c (Pspin ~3 s).
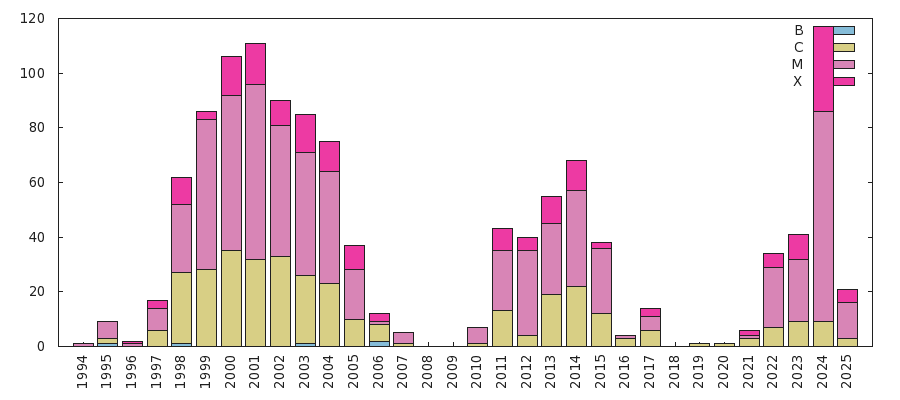
The annual occurence rates for the Konus-WIND solar flares listed here broken down by class is:
| Year | B | C | M | X | Total |
|---|---|---|---|---|---|
| 1994* | 0 | 0 | 1 | 0 | 1 |
| 1995 | 1 | 2 | 6 | 0 | 9 |
| 1996 | 0 | 0 | 1 | 1 | 2 |
| 1997 | 0 | 6 | 8 | 3 | 17 |
| 1998 | 1 | 26 | 25 | 10 | 62 |
| 1999 | 0 | 28 | 55 | 3 | 86 |
| 2000 | 0 | 35 | 57 | 14 | 106 |
| 2001 | 0 | 32 | 64 | 15 | 111 |
| 2002 | 0 | 33 | 48 | 9 | 90 |
| 2003 | 1 | 25 | 45 | 14 | 85 |
| 2004 | 0 | 23 | 41 | 11 | 75 |
| 2005 | 0 | 10 | 18 | 9 | 37 |
| 2006 | 2 | 6 | 1 | 3 | 12 |
| 2007 | 0 | 1 | 4 | 0 | 5 |
| 2008 | 0 | 0 | 0 | 0 | 0 |
| 2009 | 0 | 0 | 0 | 0 | 0 |
| 2010 | 0 | 1 | 6 | 0 | 7 |
| 2011 | 0 | 12 | 22 | 8 | 42 |
| 2012 | 0 | 4 | 31 | 5 | 40 |
| 2013 | 0 | 19 | 25 | 10 | 54 |
| 2014 | 0 | 22 | 35 | 10 | 67 |
| 2015 | 0 | 12 | 24 | 2 | 38 |
| 2016 | 0 | 3 | 1 | 0 | 4 |
| 2017 | 0 | 6 | 5 | 3 | 14 |
| 2018 | 0 | 0 | 0 | 0 | 0 |
| 2019 | 0 | 1 | 0 | 0 | 1 |
| 2020 | 0 | 1 | 0 | 0 | 1 |
| 2021 | 0 | 3 | 1 | 2 | 6 |
| 2022 | 0 | 7 | 22 | 5 | 34 |
| 2023 | 0 | 7 | 23 | 8 | 38 |
| 2024 | 0 | 9 | 76 | 30 | 115 |
| 2025 | 0 | 3 | 13 | 5 | 21 |
| All years | 5 | 337 | 658 | 180 | 1180 |
* Partial year; launch in 1 November 1994
References:
[1] Aptekar et al. 1995, Space Sci. Rev. 71, 265
[2] Pal'shin et al. 2014, Geomagnetism and Aeronomy, 54, 943
Webmaster: Anastasia Tsvetkova (Ioffe Institute)
Questions/Comments/Data requests: Konus-WIND team (Ioffe Institute)